Could we see a short-term shift towards defensive sectors? Real estate? Utilities? I haven’t uttered these words in awhile. And why should I as our major indices have forged into new all-time record high territory? Well, I’m only talking about very near-term, maybe the next 1-3 weeks? I wouldn’t change a thing as a long-term investor, I’d simply stay the course with more aggressive areas. But here are a few things that short-term traders might consider:
Seasonality
December has been a very strong month for U.S. equities, with the S&P 500 rising an astounding 55 of 74 years (74%) since 1950. That represents the most monthly advances of ANY calendar month, topping April (53) and November (51), two extremely bullish months as well. There’s more, however. Defensive groups tend to lead equities higher in December and THAT is different. If we look back the last 12 years (since this secular bull market was confirmed in April 2013), here are the average December returns for each sector, relative to the S&P 500 and prior to December 2024 (the %s in parenthesis represent December 2024 returns mid-day Friday):
- Real estate (XLRE): +1.4% (-3.3%)
- Utilities (XLU): +1.2% (-3.4%)
- Consumer staples (XLP): +0.9% (-1.2%)
- Health care (XLV): +0.7% (-2.3%)
- Financials (XLF): +0.5% (-2.5%)
- Materials (XLB): +0.4% (-3.4%)
- Communication services (XLC): +0.1% (+0.9%)
- Industrials (XLI): +0.0% (-2.8%)
- Technology (XLK): +0.0% (+1.9%)
- Energy (XLE): -0.5% (-3.8%)
- Consumer discretionary (XLY): -0.8% (+1.9%)
Thus far, in the first week of December 2024, seasonality is turned on its head. Will December 2024 simply be a strange year where we see aggressive sectors perform well all month? Or will “normal” December seasonality kick in and we see a quick rotation back towards defensive sectors?
Positive Divergences and Key Support
I believe there’s a reasonable chance of a reversal in defensive sectors back to the upside next week. Take a look at 60-minute charts of all the defensive sectors:
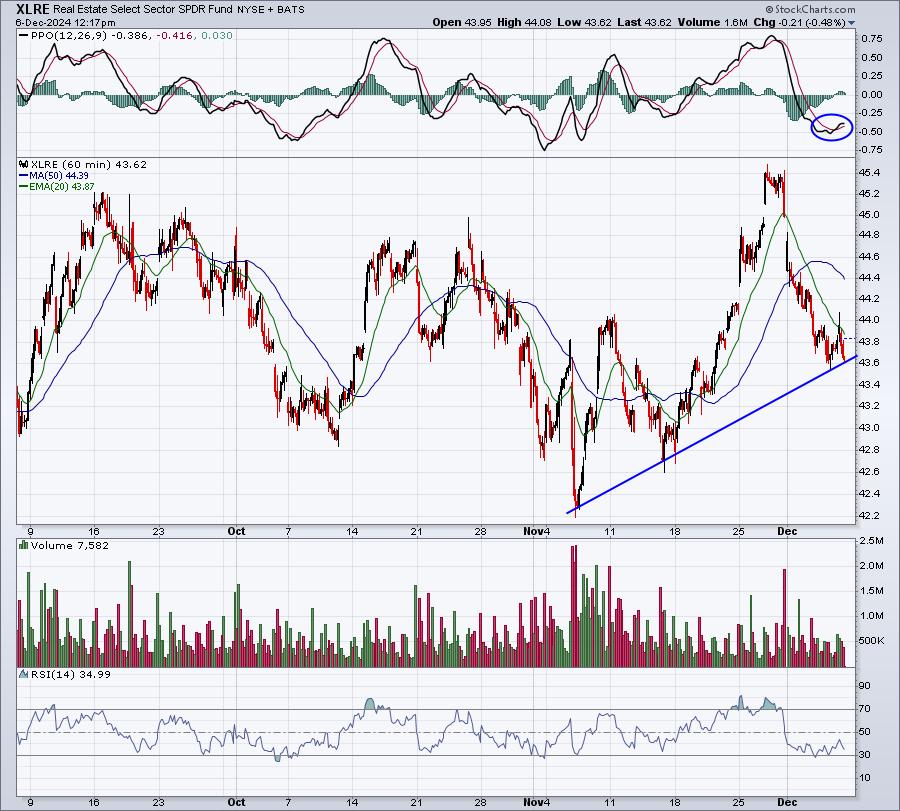
XLRE:
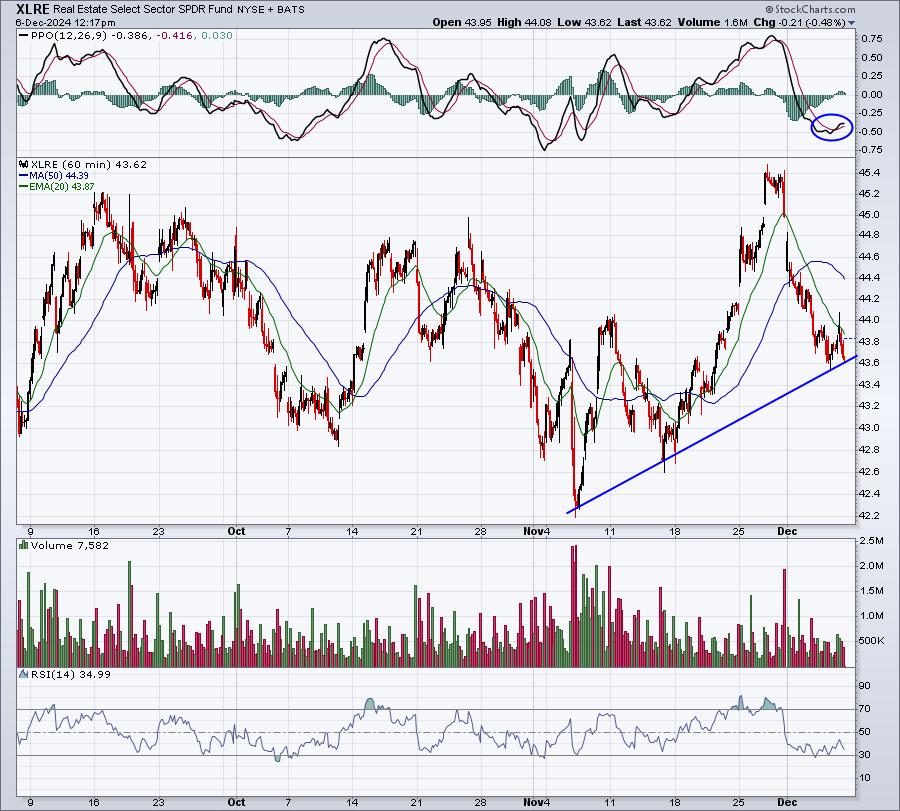
XLRE’s PPO is beginning to turn higher, just as it tests its 4-week uptrend line. If we see another low in price, it’s quite likely that a positive divergence will result, indicative of slowing downside price momentum. That, along with XLRE’s propensity to lead the market in December, has me interested in a quick trade. Seeing a reversal to the upside first would be a welcome sign. I’d at least be watching the action here over the next week.
XLU:
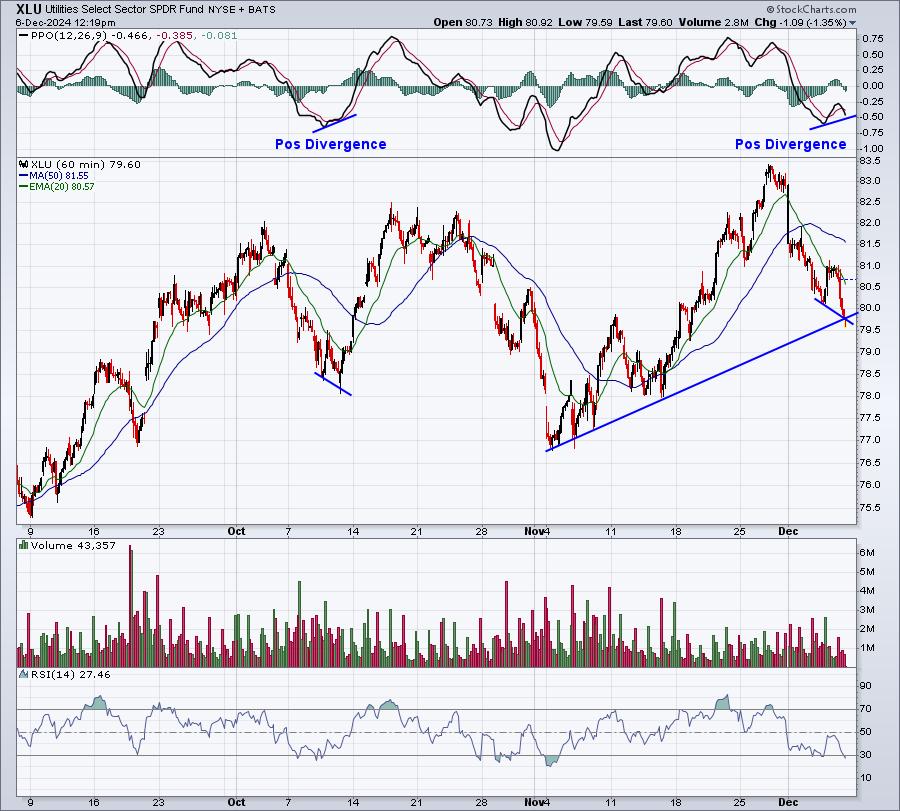
The XLU already has printed a positive divergence, suggesting a potential 50-hour test in the 81.00-81.50 area. Again, realizing utilities typical December leadership, I’m watching for a reversal.
XLP:
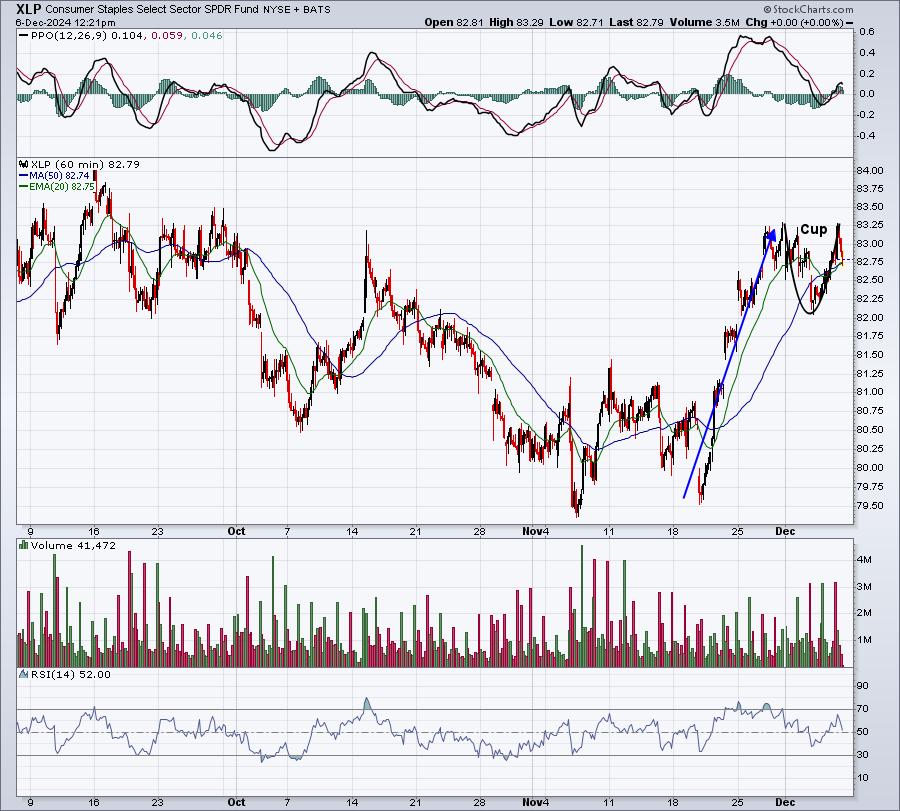
XLP looks solid after printing a bullish cup with handle continuation pattern. Consumer stocks have been strong, especially consumer discretionary (XLY). But XLP likes December, so we’ll see if it can outperform the XLY for a brief period.
XLV:
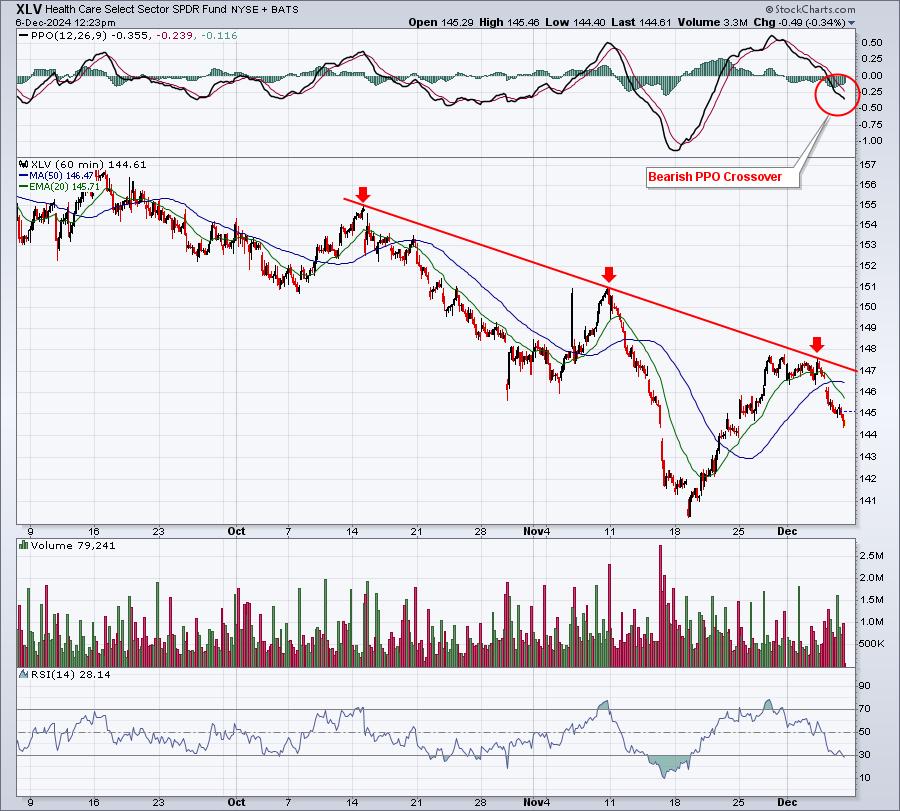
Ok, I’m not seeing much bullishness here. I have recently discussed the long-term support on XLV near the 137 level, prior to the latest bounce from 140. Currently, however, I see a bearish PPO crossover and no solid price support nearby. There’s a gap support level just above 144 that might hold, but otherwise, XLV could be poised for a return visit to 140.
Historical Annualized Returns By Day By Major Index
While December is a bullish month for our major indices, we are rapidly approaching the worst period within December. We break down the strong and weak periods for our EarningsBeats.com subscribers every month in our EB Monthly Seasonality Report and we provide upcoming daily annualized performance numbers in our EB Weekly Market Report (WMR). Our latest WMR highlighted the following daily annualized returns for the first half of December on the S&P 500, NASDAQ, and Russell 2000:
S&P 500 (since 1950)
- Dec 2: +20.80%
- Dec 3: -37.54%
- Dec 4: +34.45%
- Dec 5: +36.61%
- Dec 6: +44.90%
- Dec 7: +22.82%
- Dec 8: +16.37%
- Dec 9: -7.56%
- Dec 10: +9.26%
- Dec 11: -41.19%
- Dec 12: +2.75%
- Dec 13: -0.12%
- Dec 14: -62.95%
- Dec 15: -17.54%
NASDAQ (since 1971)
- Dec 2: +39.30%
- Dec 3: -54.04%
- Dec 4: +22.34%
- Dec 5: +99.62%
- Dec 6: +13.03%
- Dec 7: +1.36%
- Dec 8: +53.51%
- Dec 9: -69.02%
- Dec 10: +53.82%
- Dec 11: -86.19%
- Dec 12: -14.96%
- Dec 13: -61.84%
- Dec 14: -109.19%
- Dec 15: -29.80%
Russell 2000 (since 1987)
- Dec 2: +121.88%
- Dec 3: -26.06%
- Dec 4: +32.13%
- Dec 5: +136.88%
- Dec 6: +48.07%
- Dec 7: -26.09%
- Dec 8: +93.55%
- Dec 9: -90.45%
- Dec 10: -18.96%
- Dec 11: -104.36%
- Dec 12: +16.47%
- Dec 13: -38.62%
- Dec 14: -87.43%
- Dec 15: -36.23%
The first week of December held true and was very bullish, especially the large cap growth stocks that drove outperformance in both the S&P 500 and NASDAQ.
Beginning on December 9th (Monday), though, we have seen plenty of historical weakness. This does NOT guarantee us lower prices next week. I’m simply pointing out historical tendencies. I remain cautiously bullish in the upcoming week, but absolutely believe our major indices are heading higher in time. This can mean different things to different traders. But with this type of historical weakness, I will avoid leveraged products on the long side and I’ll likely trade stocks in defensive sectors as well as stocks in aggressive sectors, just to hedge a bit.
Big Picture Rotation and a HUGE Event
NOTHING is more important than following rotation and understanding where Wall Street is positioning and re-positioning. Nothing will help your trading success more than following this rotation and taking advantage of it. That’s why we’re hosting a completely FREE event on Saturday, December 14th at 10:00am ET, “Key Market Rotation Heading Into 2025”. Who better to invite to join me than Julius de Kempenaer, the creator of Relative Rotation Graphs (RRG) charts, Sr. Technical Analyst as StockCharts.com, founder of RRG Research, and host of “Sector Spotlight” on YouTube? Julius and I would love for you to join us as we debate the merits of owning various asset classes, sectors, industries, and individual stocks in 2025. In particular, we’ll address the outlook for the Mag 7 stocks like AAPL, NVDA, and others. For more information and to register for this very timely topic, CLICK HERE! Keep in mind that ALL those who register will receive a recording of the event. So if you can’t make the event live, no worries at all!
Happy trading!
Tom

