This morning, Americans woke up to the latest scores from the Trends in International Mathematics and Science Study (TIMSS), tests taken by students in 63 countries and other jurisdictions in fourth grade and 45 in eighth grade. The United States has participated since the exams began in 1995.
In fourth-grade math, the US average hit its lowest level in the history of the exam: 517, dipping below the previous 1995 and 2003 low of 518.

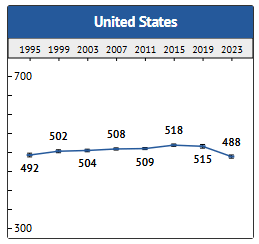
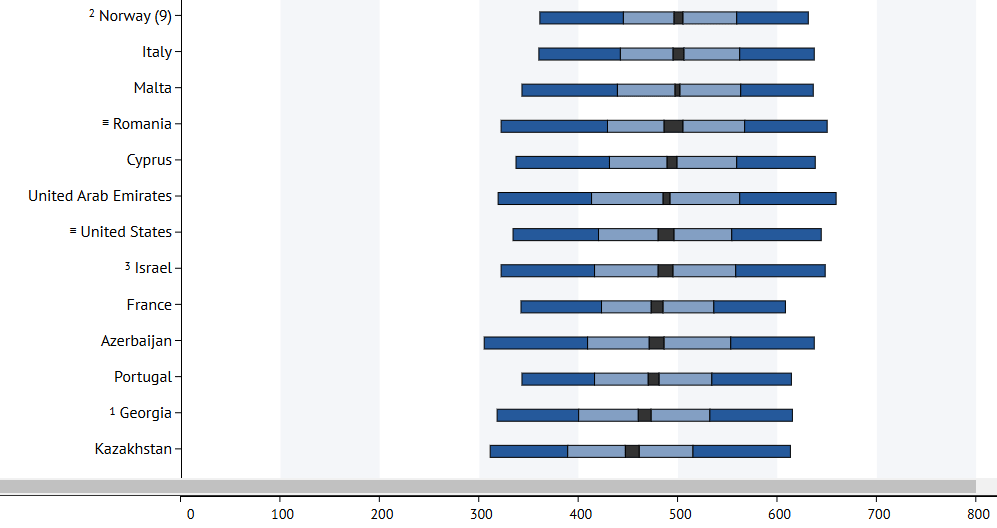
In eighth-grade math, the average hit its lowest point: 488, dipping below the previous low of 492. Note, however, that the United States did not hit the TIMSS guidelines for sample participation rates, so the results should be taken with a grain of salt.
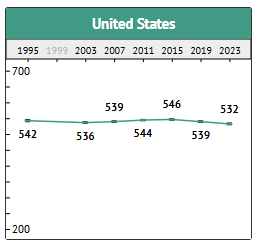
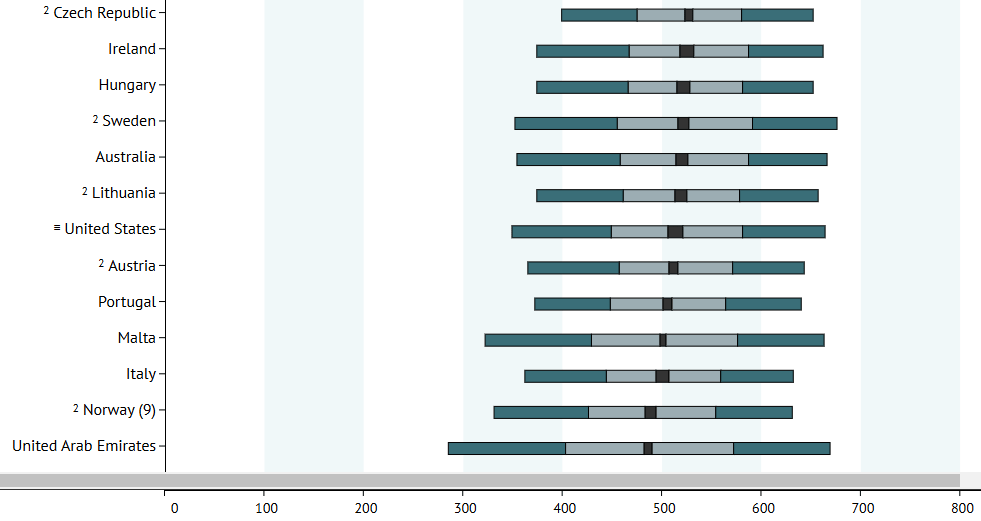
The country hit another low in fourth-grade science, with an average score of 532.
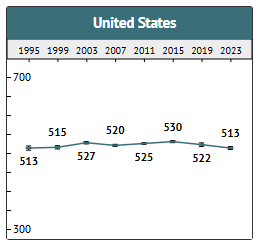
Finally, in eighth-grade science, the country tied its previous low of 513, set again at the very beginning of TIMSS testing. As with math, these results should be viewed with caution due to low participation rates.
In terms of international standing, the United States is middling. Looking at eighth grade, which accounts for students having spent more time in the American education system than fourth, the country finished below nations such as Italy and Romania but above Israel and France. The top performers (not shown) were Singapore, Chinese Taipei—not all of China—and South Korea. The United States scored above 18 systems and below 19.
In science, the United States was closer to the top, below countries such as Ireland and Sweden, and above Austria and Italy. The top performers (again, not shown) were Singapore, Chinese Taipei, and Japan. US students scored better than 27 systems and below 11.
All things equal, we do not want to see US scores go down—indeed, hitting near 30-year lows. This is especially the case when we look at public school per-pupil spending, which, adjusted for inflation, rose from $12,366 in the 1994–95 school year to $18,614 in 2020–21, a 51 percent increase.
But things are not always equal. The most likely explanation for the country’s major drop is the COVID-19 epidemic, especially the long lockdowns of some schools. But our scores have been dropping largely since 2015, when the No Child Left Behind Act, which focused the entire public schooling system on standardized testing, was replaced by the Every Student Succeeds Act. The country’s decreased emphasis on standardized testing generally could be reflected in this particular standardized test. And a diminished focus on standardized testing might not necessarily be bad. Much of what people want from education—fostering creative thinking, building character, and more—is not well captured by standardized tests. And if rising scores reflected standardized testing strategies more than rising knowledge, they might have given us false signals.
Of course, we would like to see test scores rise. But we should not panic: We need to investigate these scores more deeply to understand what produced them, and standardized tests are limited in what they can tell us about education quality.

